
The countdown to election season is officially on. For newsrooms and digital media teams, that means bracing for a wave of live debates, town halls, and fast-moving results. It also means figuring out how to build hours of engaging content without burning out your team or your budgets.
To help you stay ahead of the chaos, we’ve officially expanded the Tagboard Template Library with a brand-new suite of Elections Templates.
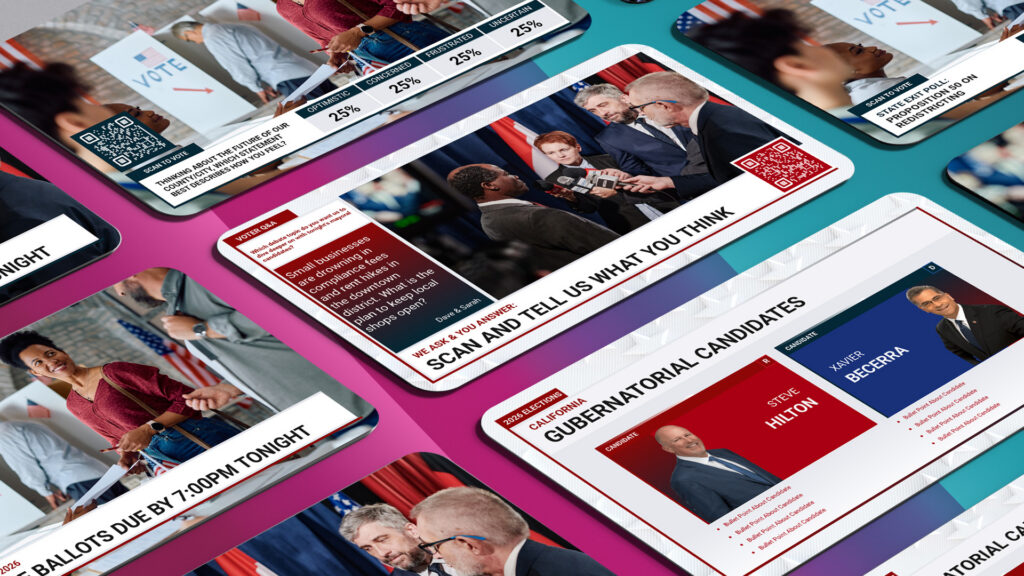
Designed to look great on air or online, these templates are built for speed, audience engagement, and resource efficiency. We know elections coverage is some of the most graphics heavy content you will produce, so here is a breakdown of how these templates will support or add to your coverage:
User-Generated Content (UGC) Templates

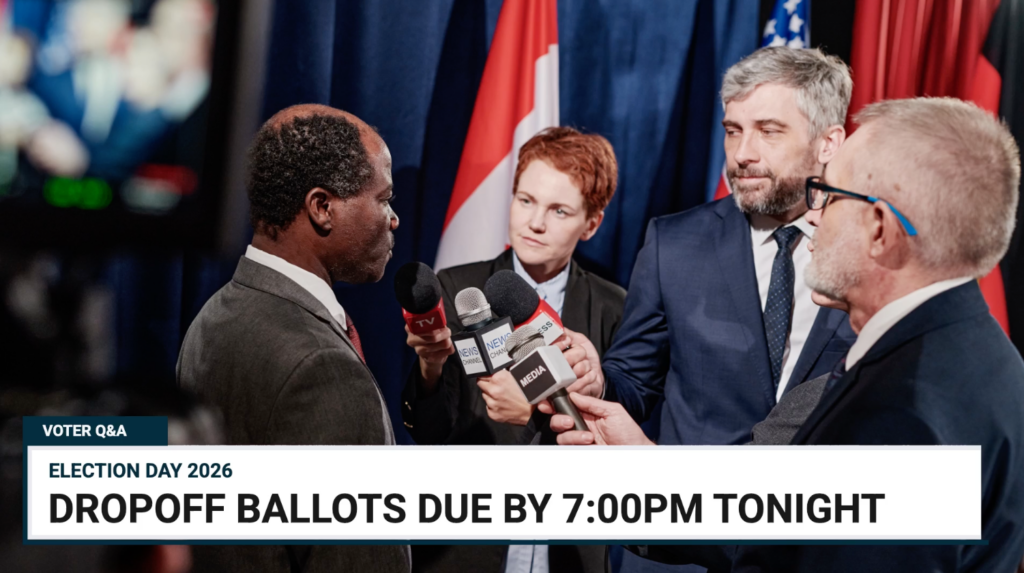
Elections shouldn’t be a one-way street. It’s important to ask, listen, and respond to your audience in every broadcast, but maybe no more so than during elections coverage, where the central theme is all about the voice of the people.
These templates allow you to seamlessly pull in viewer opinions in a direct-to-you workflow, where your audience doesn’t have to post onto social platforms to share their voice. This path invites everyone in your audience to respond without the fear of a comment section. In addition to the viewer comments, you can also bring in breaking news posts from across the social media landscape from candidates, county clerk offices, and more official sources.
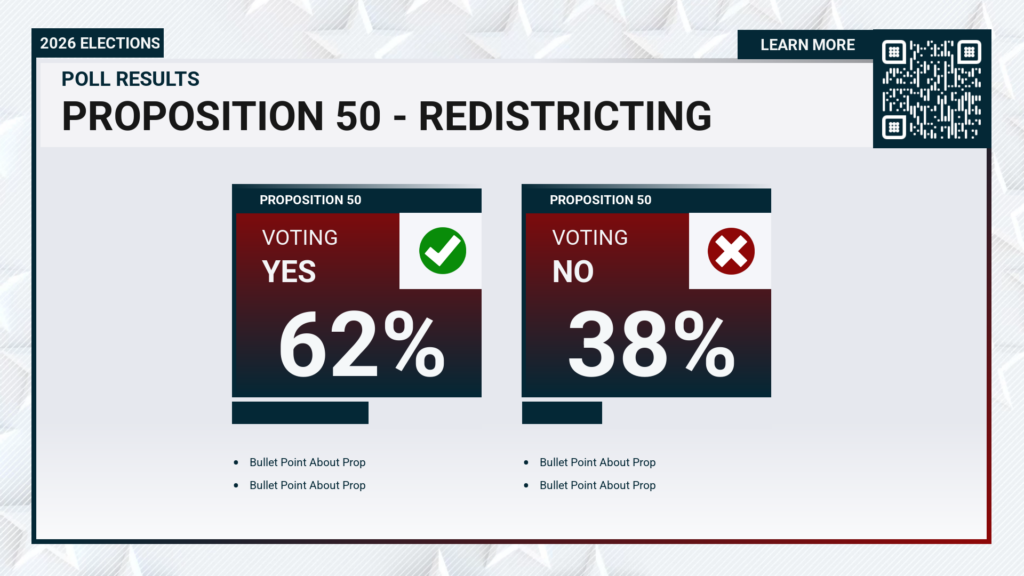
Interactive Polls (Without the Politics)
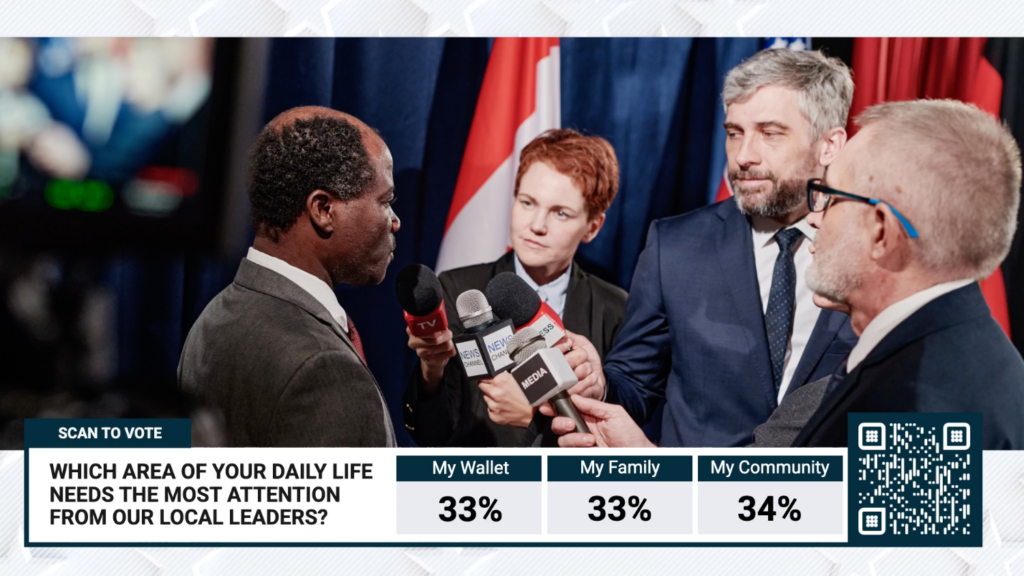
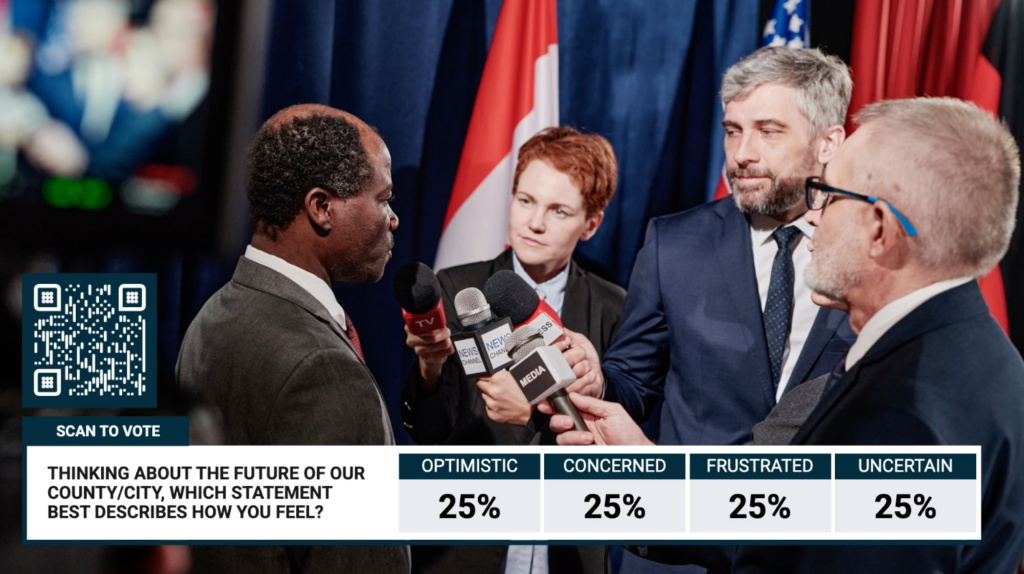
Gather instant feedback on big local propositions or ask your audience which debate topics they want covered next. These templates are designed to gauge general sentiment and issue-based opinions. We deliberately steer clear of “Who are you voting for?” head-to-head polls to ensure your coverage remains a safe, constructive space for everyone.
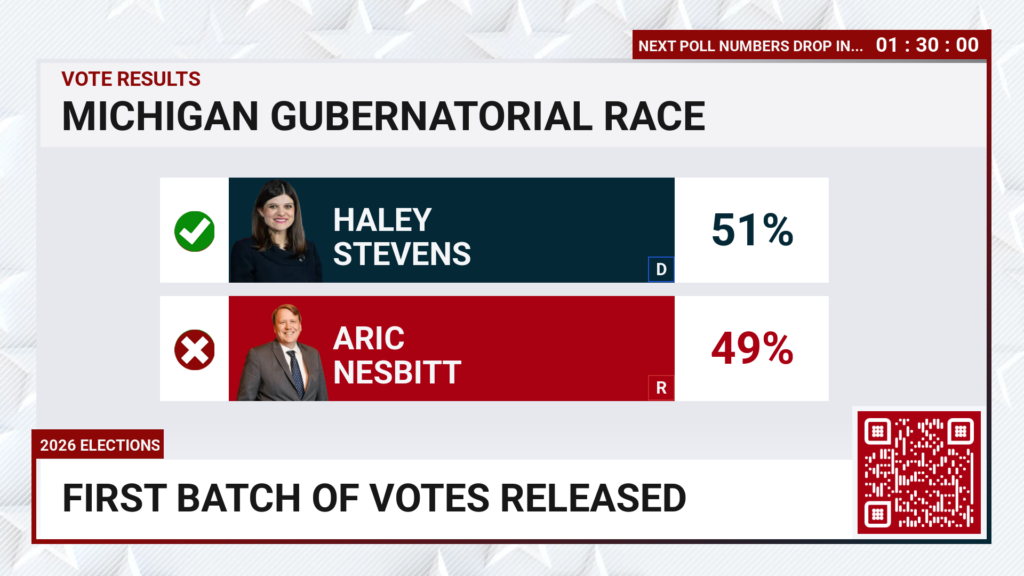
Google Sheets Automated Results Graphics
Not every station or digital team has an Associated Press (AP) live data feed integration. Historically, that meant assigning a producer to sit there and manually type numbers into a graphic wrapper as percentages rolled in. Not anymore. These templates plug directly into a simple Google Sheet that can be powered by publicly available data feeds. Update the sheet, and the data instantly populates your live graphic. It eliminates manual errors and gets your results on-screen faster than ever.
Beyond looking sharp, the real magic of this suite is operational efficiency. These templates are engineered to let teams effortlessly launch new digital shows, post-debate analysis streams, and secondary coverage.
Because Tagboard operates in the cloud, you don’t need to route these productions through a traditional control room.
A lean digital team can produce a fully interactive, data-driven election special right from a laptop. By freeing up your heavy master control resources, you save massively on production costs while simultaneously pumping out more content, higher viewer engagement, and faster reporting than the competition.